Brain Cancer Diagnostics
The invention of ambient ionization mass spectrometry methods, such as desorption electrospray ionization (DESI), significantly increased the potential for point-of-care diagnostics with MS based methods. With these techniques, detailed metabolomic and lipidomic data can be acquired in seconds from fresh tissue. DESI-MS was used to profile normal and cancerous tissues and methodologies for the rapid intraoperative diagnosis of cancer from surgical tissue biopsies were developed.
DESI-MS imaging with a morphologically friendly solvent system (1:1 DMF-ACN) was used for the chemical mapping of heterogeneous brain and glioma (a type of malignant brain tumor) tissue sections (~200µm spatial resolution) followed by their histological staining (H&E) and assessment for pathological features. Bioinformatics approaches, based on principal component analysis (PCA), were utilized to correlate the MS information with the tissue pathology, permitting the creation of statistical models (based on linear discriminant analysis (LDA)) that were used to classify tissue samples as normal or tumor.
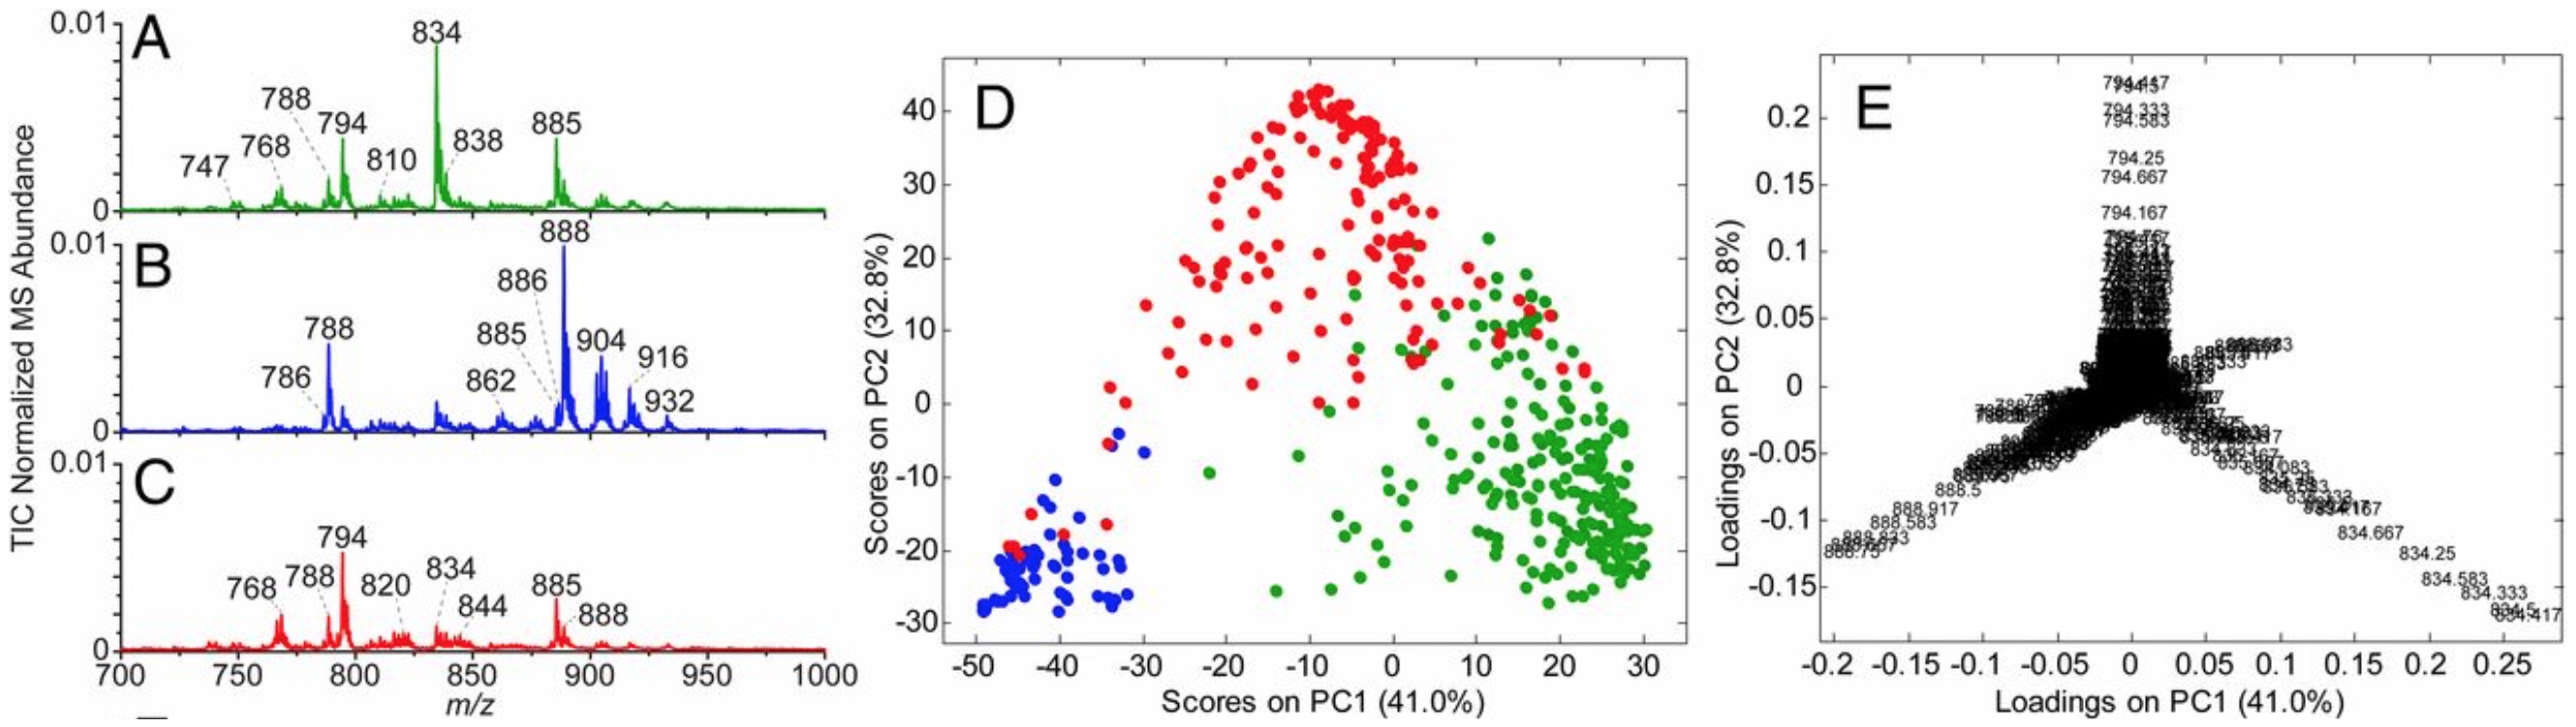
Figure 1. Average lipid (m/z 700–1,000) and metabolite (m/z 80–200) MS profiles for gray matter (n = 223), white matter (n = 66), and glioma (n = 158) with PCA score and loading plots. Average normalized [total ion chronogram (TIC)] lipid MS profile for (A) gray matter, (B) white matter, and (C) glioma. (D) PCA score plot [principal component 1 (PC1) vs. principal component 2 (PC2)] using lipid profile information for gray matter (green circles), white matter (blue circles), and glioma (red circles). (E) PCA loading plot with m/z annotated.
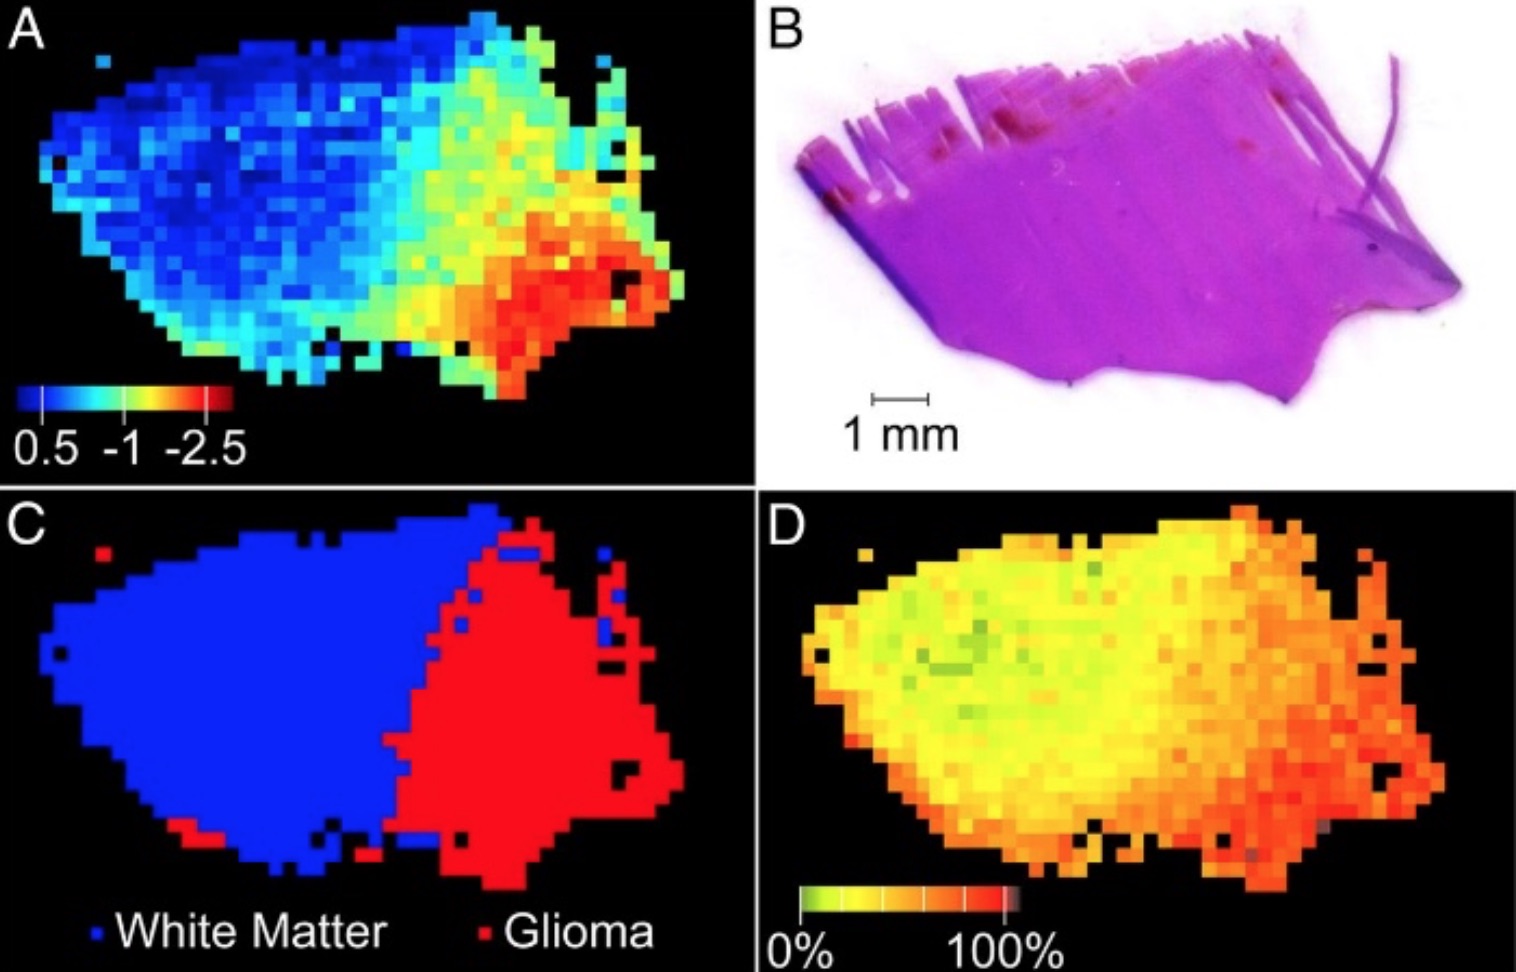
Figure 2. DESI-MS predictions for specimen 65 and corresponding H&E. (A) PCA projection (false color) indicates PC1 score values. (B) H&E stain. (C) PCA LDA prediction of class and (D) calculated tumor cell concentration based on NAA abundance.
The ion corresponding to N-acetylaspartate (m/z 174 in the negative ionization mode) was a significant univariate predictor of normal brain tissue or glioma (Kruskal-Wallis P-value < 0.001; ROC AUC = 0.998 N-acetylaspartate). Its intensity correlated inversely with the relative percentage of tumor cells, also referred to as tumor cell concentration, present in the tissue section (Fig. 3A).
The molecule 2HG is produced exclusively by cells expressing a mutant form of the isocitrate dehydrogenase (IDH) gene. A 2HG concentration difference of nearly 2 orders of magnitude was observed between gliomas that are IDH-wild-type vs. IDH-mutant. However, the DESI-MS solvent system used for detecting the phospholipids and NAA were inadequate for detection of 2HG. An optimized solvent system containing DMF-ACN-EtOH (25/37/38 %v/v) was found to be optimal for extracting 2HG from brain tissue and provided reliable discrimination between IDH-wild-type and IDH-mutant gliomas (Fig. 3B).
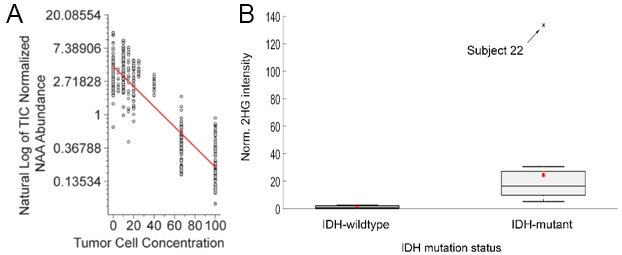
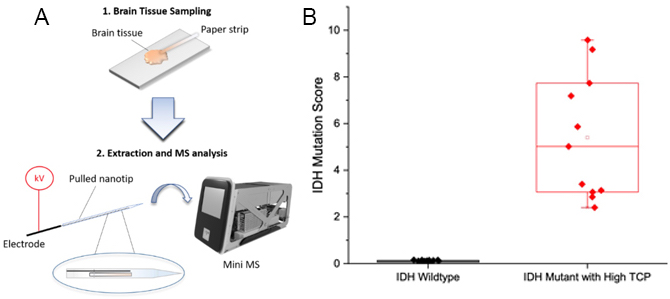
Figure 3. (A) Natural log f the TIC normalized NAA abundance of grey matter, white matter, and glioma samples plotted versus tumor cell concentration. A line was fit to the data using simple linear regression and the equation is y = - 0.03x + 1.45 (Pearson’s r = - 0.89). (B) Intraoperative discrimination between IDH-wildtype and IDH-mutant gliomas via DESI-MS 2HG measurement. Box-and-whisker plot obtained from the patient cohort of the intraoperative study. IDH-wildtype subjects, n=14; IDH-mutant subjects, n=11.
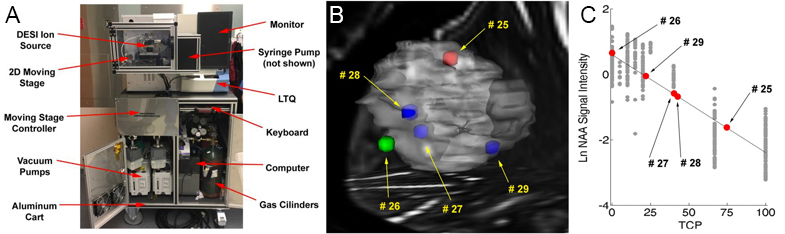
A linear ion trap mass spectrometer (LTQ-MS) was modified for use in the operating room. The system contains all the equipment necessary for instrument function (computer, high purity compressed gas cylinders, power converters, moving stage controller) and can be maneuvered by a single person into the OR. Patients with suspected gliomas were recruited into our IRB approved study at IU School of Medicine, and small pieces of resected tissue were provided to us, smeared on a glass slide, and analyzed with DESI-MS in the operating room. Utilizing the classification methods described in Figure 1-4, we provide a prediction of the tissue biopsy disease state, extent of tumor infiltration, and IDH mutation status for every sample.
Most recently, we’ve developed an ambient ionization-MS assay for 2HG detection on a miniature mass spectrometer. This overcomes the limitations of using a large and more expensive instrument, further increasing the promise of point-of-care diagnostics with MS. Experiments with banked frozen brain and glioma tissue, including IDH-wild-type and IDH-mutant samples, were performed and resulted in excellent capability to differentiate between IDH-wild-type and IDH-mutant samples.
Publications
- Takáts, Z.; Wiseman, J. M.; Gologan, B.; Cooks, R. G., Mass Spectrometry Sampling Under Ambient Conditions with Desorption Electrospray Ionization. Science 2004, 306 (5695), 471
- Eberlin, L. S.; Ferreira, C. R.; Dill, A. L.; Ifa, D. R.; Cheng, L.; Cooks, R. G., Nondestructive, Histologically Compatible Tissue Imaging by Desorption Electrospray Ionization Mass Spectrometry. ChemBioChem 2011, 12 (14), 2129-2132
- Jarmusch, A. K.; Pirro, V.; Baird, Z.; Hattab, E. M.; Cohen-Gadol, A. A.; Cooks, R. G., Lipid and metabolite profiles of human brain tumors by desorption electrospray ionization-MS. Proc. Natl. Acad. Sci. U. S. A. 2016, 113 (6), 1486
- Alfaro C. M.; Pirro, V.; Keating, M.; Hattab, E. M.; Cooks, R. G.; Cohen-Gadol, A. Intraoperative assessment of isocitrate dehydrogenase mutation status in human gliomas using desorption electrospray ionization-mass spectrometry. J. Neurosurgery 2020, 132, 180-187
- Yannell, K. E.; Smith, K.; Alfaro, C. M.; Jarmusch, A. K.; Pirro, V.; Cooks, R. G., N-Acetylaspartate and 2-Hydroxyglutarate Assessed in Human Brain Tissue by Mass Spectrometry as Neuronal Markers of Oncogenesis. Clin. Chem. 2017, 63 (11), 1766-1770
- Pirro, V.; Alfaro, C. M.; Jarmusch, A. K.; Hattab, E. M.; Cohen-Gadol, A. A.; Cooks, R. G., Intraoperative assessment of tumor margins during glioma resection by desorption electrospray ionization-mass spectrometry. Proc. Natl. Acad. Sci. U. S. A. 2017, 114 (26), 6700
- Pu, F.; Alfaro, C. M.; Pirro, V.; Xie, X.; Ouyang, Z.; Cooks, R. G., Rapid Determination of isocitrate dehydrogenase state of human gliomas by extraction nanoelectrospray using a miniature mass spectrometer. Anal. Bioanal. Chem. 2019, 411 (8), 1503-1508