MRM-Profiling for Lipidomics and Metabolomics
Small molecules, including metabolites and lipids, play significant roles in disease and especially in cancer. Diagnosis, prognosis and therapy of certain diseases have been designed or improved with increasing knowledge from pathway analysis. However, discovery and characterization of small molecule metabolic functions has been a challenging task for years. Current exploratory methodologies for metabolomics and lipidomics are based on liquid or gas chromatography(LC or GC) coupled with high resolution mass spectrometry(HRMS) to generate a large set of data involving lengthy data acquisition, typically 30-60 min per sample. Even though many molecules can be distinguished by these methods, the highly laborious protocols for purification, identification, and validation results in loss or dilution of sample chemical information and high costs.
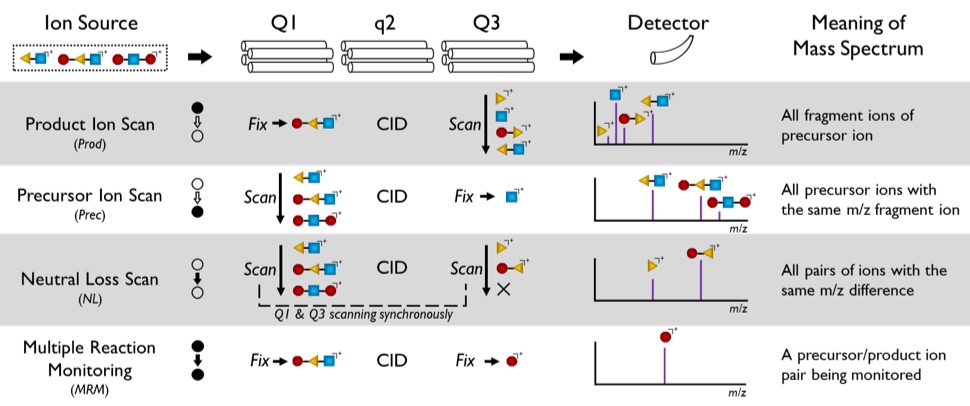
Figure 1. Four basic operations of a triple quadrupole mass spectrometer: product ion scan (Prod), precursor ion scan (Prec), neutral loss scan(NL), and multiple reaction monitoring(MRM). Operation on each quadrupole mass filter is either “Fix” or “Scan”, except that q2 is always where fragmentation happens.
To improve the speed and efficiency of exploratory metabolomics and lipidomics in covering the diversity of chemistry in these areas, multiple reaction monitoring profiling(MRM-Profiling) has been developed by examining the metabolome as a collection of functional groups. MRM-Profiling is based on tandem mass spectrometry experiments carried out on a commercial triple quadrupole mass spectrometer with three aligned quadrupole mass filters(Q1, q2, and Q3). A quadrupole mass filter can be operated as either a mass selector (m/zof resulting ions fixed at a specific value, “Fix” in Figure 1) or a mass analyzer (m/zof resulting ions scanned in a certain manner, “Scan” in Figure 1). Since the second quadrupole(q2) is employed for collision-induced dissociation(CID), altogether four types of combination are possible as illustrated in Figure 1: product ion scan(Prod), precursor ion scan(Prec), neutral loss scan(NL), and multiple reaction monitoring(MRM). Each peak in mass spectra of these MS/MS experiments can be projected on a 2D MS/MS data domain as a point corresponding to a precursor/product ion pair(Figure 2.Left). The three scan methods(Prod, Prec, and NL) can be presented as lines in this coordinate system. Among these scan methods, Prec and NL can offer more insight in terms of functional groups. For example, sphingomyelin(SM) and phosphatidylcholine(PC) are two common classes of lipids. Both SM and PC have the same phosphocholine head group and phosphocholine ion (m/z 184.1) can be observed when both lipids are fragmented, structures of which are shown in Figure 2.Right. Thus, a Prec scan of 184.1 can be applied to detect SM and PC in positive ion mode.
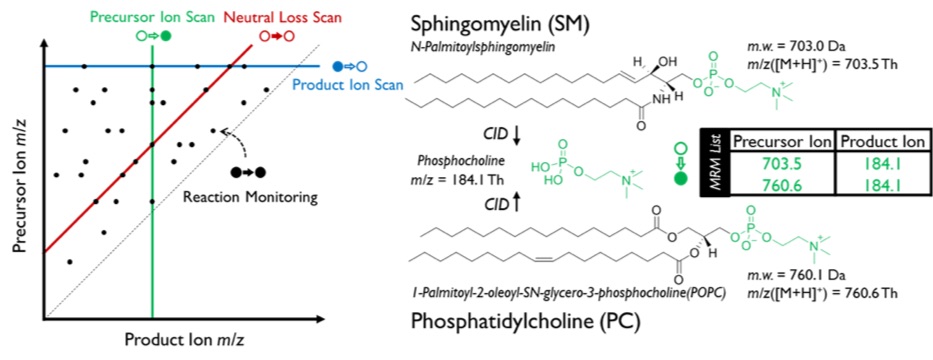
Figure 2. (Left) 2D MS/MS data domain with representations of different scan methods and MRM. (Right) Typical structures of sphingomyelin and phosphatidylcholine and common fragment, phosphocholine ion.
With help from Prec and NL scans, multiple reaction monitoring profiling (MRM-Profiling) moves one step further by using different scan methods implemented for various types of functional groups. Proposed procedure of MRM-Profiling is shown in Figure 3. MRM-Profiling starts with a Discovery Stage, intended to interrogate the sample for many functional groups by precursor scans(Prec) and neutral loss scans(NL) usually using a triple quadrupole mass spectrometer but without chromatography. For the second stage of MRM-Profiling, Screening Stage, the information from the Prec and NL scans is organized into lists of transitions(also called MRMs) that are used for the fast, specific and sensitive interrogation of individual samples. The difference of numbers of MRMs applied to samples between two stages is plotted on the 2D MS/MS plane in Figure 4. Data analysis by univariate and multivariate statistical methods is used to isolate the informative MRMs, which can then be further explored in structural studies and validated as biomarkers. The MRM-Profiling strategy benefits from the much smaller number of functional groups compared to the number of individual metabolites, most of which are still unknown, resulting in a much smaller data set acquired for analysis and shorter time needed for data collection. In general, the methodology produces ~103times less data and saves instrument time by a factor of 10 compared to conventional LC-MS/MS methods.
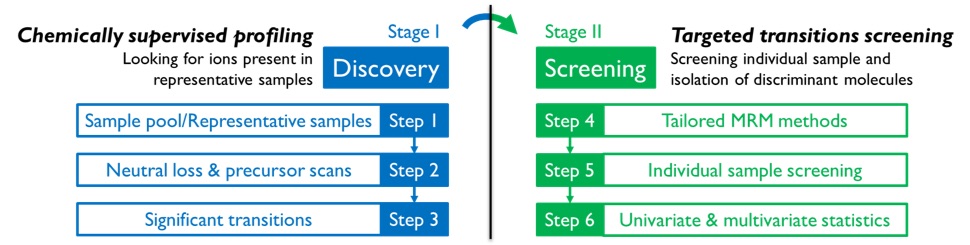
Figure 3. Two stages in proposed procedure of MRM-Profiling: Discovery and Screening.
The most recent research of applying MRM-Profiling on human plasma coronary artery disease(CAD) samples has achieved an accuracy of 90%, 78%, and 85% in classifying the CAD female, CAD male, and peripheral artery disease (PAD) samples, respectively. The total time for individual screening was <5 days for 1000 samples. Part of the results(female CAD and male CAD) are shown in Figure 4.Right. The responsible compounds from the most informative MRMs were identified and corresponding regulation relationship was summarized in table. The multivariate statistics was also carried out. MRM-Profiling has also been applied to Parkinson’s disease, human polycystic ovarian syndrome, atopic dermatitis, and cardiac disease diagnosis, diet compliance and animal fertility prediction, as tabulated in Table 1. More insight on diagnosis and mechanistic understanding of data acquired using MRM-Profiling is now underway.
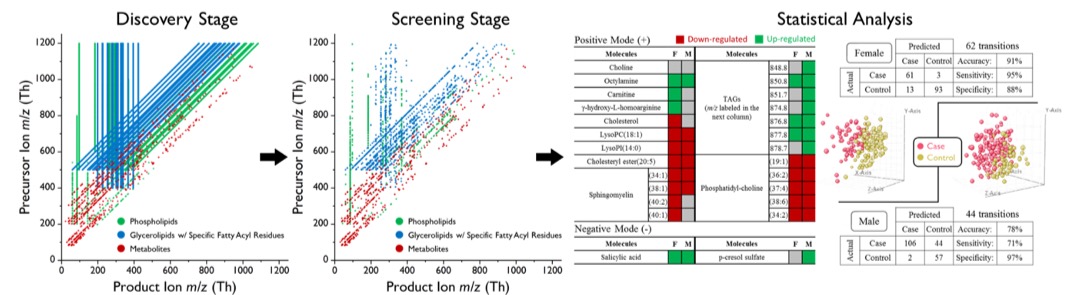 Figure 4. The change in number of transitions in different stages. (Left) All the observed transitions from representative samples are scattered on the 2D MS/MS domain. (Middle) Significant transitions that will be applied to screen individual sample are scattered on the same plane. (Right) Data from each sample are analyzed by univariate or/and multivariate statistical methods. The significance of each transition or up-/down-regulation relationship can be figured out.
Table 1. Scope of MRM Profiling
| Case | # MRMs | Time (min/sample) | Performance |
|---|---|---|---|
|
Parkinson’s disease |
118 |
1-2 |
76% agreement with clinical data for males, 72% agreement with clinical diagnosis for 60 blind samples |
|
Polycystic ovarian syndrome |
1012 |
12 |
73% agreement with clinical diagnosis for the 26 blind samples |
|
Coronary artery disease (CAD) |
485 |
<5 |
>900 samples investigated. Accuracy of 90%, 78%, and 85% for CAD female, CAD male, and peripheral artery disease classification |
|
Embryo metabolism (bovine oocytes) |
383 |
4 |
Discrimination of development stages |
Publications
- Ferreira, C. R.; Yannell, K. E.; Mollenhauer, B.; Espy, R. D.; Cordeiro, F. B.; Ouyang, Z.; Cooks, R. G., Chemical profiling of cerebrospinal fluid by multiple reaction monitoring mass spectrometry. Analyst 2016, 141 (18), 5252-5255.
- Cordeiro, F. B.; Ferreira, C. R.; Sobreira, T. J. P.; Yannell, K. E.; Jarmusch, A. K.; Cedenho, A. P.; Lo Turco, E. G.; Cooks, R. G., Multiple reaction monitoring (MRM)-profiling for biomarker discovery applied to human polycystic ovarian syndrome. Rapid Commun. Mass Spectrom. 2017, 31 (17), 1462-1470.
- Yannell, K. E.; Ferreira, C. R.; Tichy, S. E.; Cooks, R. G., Multiple reaction monitoring (MRM)-profiling with biomarker identification by LC-QTOF to characterize coronary artery disease. Analyst 2018, 143 (20), 5014-5022.
- Lima, C. B.; Ferreira, C. R.; Milazzotto, M. P.; Sobreira, T. J. P.; Vireque, A. A.; Cooks, R. G., Comprehensive Lipid Profiling of Early Stage Oocytes and Embryos by MRM Profiling. J. Mass Spectrom. 2018, DOI: 10.1002/jms.4301